This page explains how to draw a profit and loss histogram using Python (seaborn) based on a CSV-formatted file saved by the "MQL4 Script to Save MT4's Order History to CSV file".
The CSV file is in the following format. The first line is a header (comment), and the second and subsequent lines contain the order history.
Each line is separated by commas and includes the open time, close time, number of lots, profit and loss, symbol name, and order type.
OpenTime,CloseTime,Lots,Profit,Symbol,Buy/Sell
2020.10.26 03:54:05,2020.10.26 04:10:03,1.41,-4371,USDJPY-cd,Sell
2020.10.26 04:21:22,2020.10.26 05:01:09,1.41,11985,USDJPY-cd,Buy
2020.10.26 07:23:36,2020.10.26 08:59:58,1.42,-426,USDJPY-cd,Buy
2020.10.26 10:00:11,2020.10.26 10:19:02,1.42,-710,USDJPY-cd,Buy
2020.10.26 10:36:15,2020.10.26 10:56:00,1.4,3360,USDJPY-cd,Sell
The Python script is as follows. I use pandas to read CSV files and matplotlib with seaborn to draw the histogram.
import matplotlib.pyplot as plt
import seaborn as sns
import pandas as pd
# Path to the CSV file (change accordingly)
path = r'C:\HogeHoge\OrderHistory.csv'
# Reading CSV file
df = pd.read_csv(path)
# apply seaborn's default theme
sns.set()
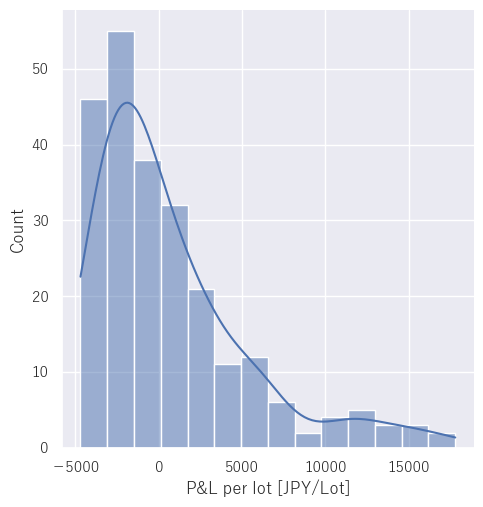
# normalize the profit and loss per lot and draw a histogram
sns.displot(df['Profit']/df['Lots'], kde=True)
# Configuring x-axis labels
plt.xlabel('P/L per lot [JPY/Lot]')
# Display Graph
plt.show()
If you run it, you can draw a histogram like the following.
 Home
Home